The beauty of calculus
11 Aug 2016Recently, a discussion with a friend made me realize that a lot of students are taught calculus as a bunch of formulae and not as a useful concept to understand several phenomena in the universe. To show the beauty of calculus, I decided to write a small tutorial explaining the basic concepts of limits, differentiation and integration. Immediately connecting these concepts, I will also show how basic motion laws in physics can be interpreted.
Slope, Limits, Differentiation & Integration
We will be using one and only one curve the whole tutorial, it will change its
purpose and meaning as we go by. But the curve will remain the same and between
the exact same points P1 = (x1,y1) and P2 = (x2,y2).
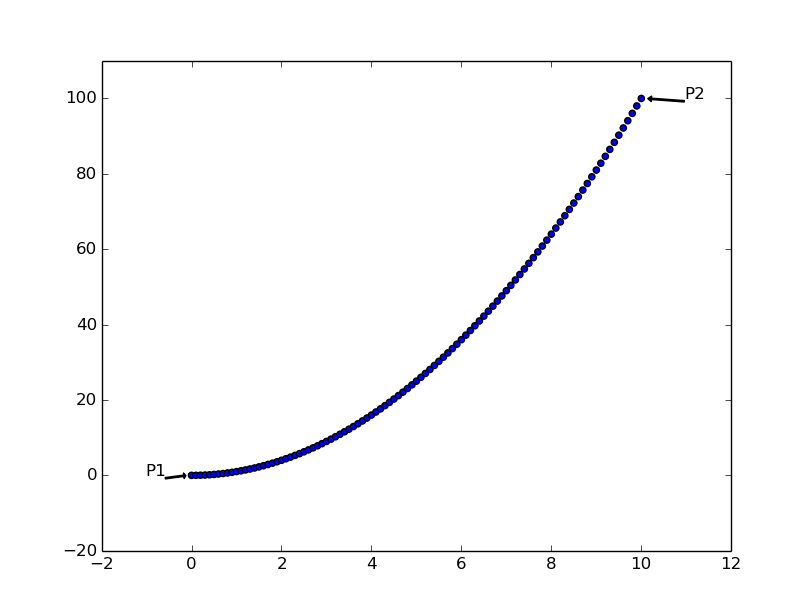
Figure 1: The one curve that will help us all.
When we graph something, we are always showing a relation between the variables
plotted on the different axes. In effect, we can say that y = f(x), where f
is some function. Some of the examples could be:
\[f(x) = 3x + 15x^2\]
Anyways, we all know that two points form a straight line and the slope of the line (or inclination) is given by \(\frac{y2 - y1}{x2 - x1}\). This is simple! Plotting this line along with the curve looks this way.
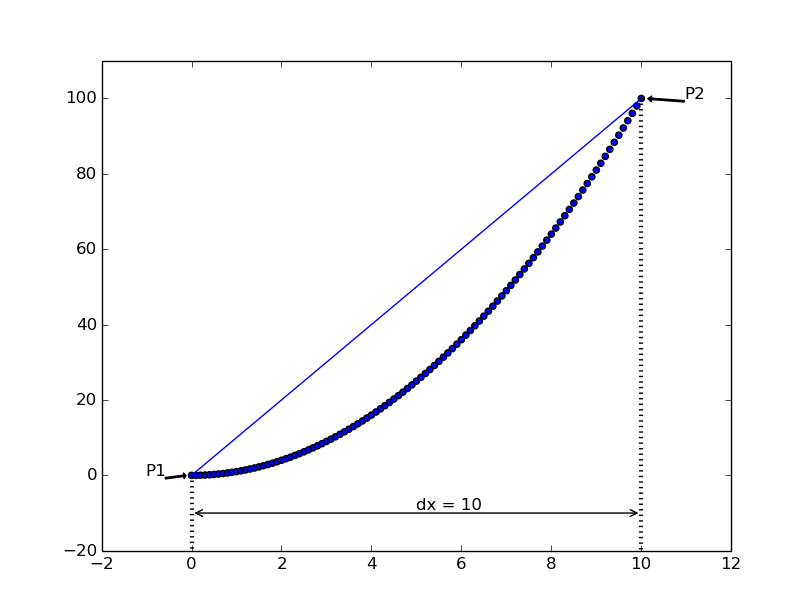
Figure 2: If we pay attention to the line, we can see that \(dx = (x2-x1)\), with \(dx = 10\)
Instead of one line, if I put a point (P3) in the middle of the curve and plot two lines, they will have different slopes. The lines along with the plot look this way.
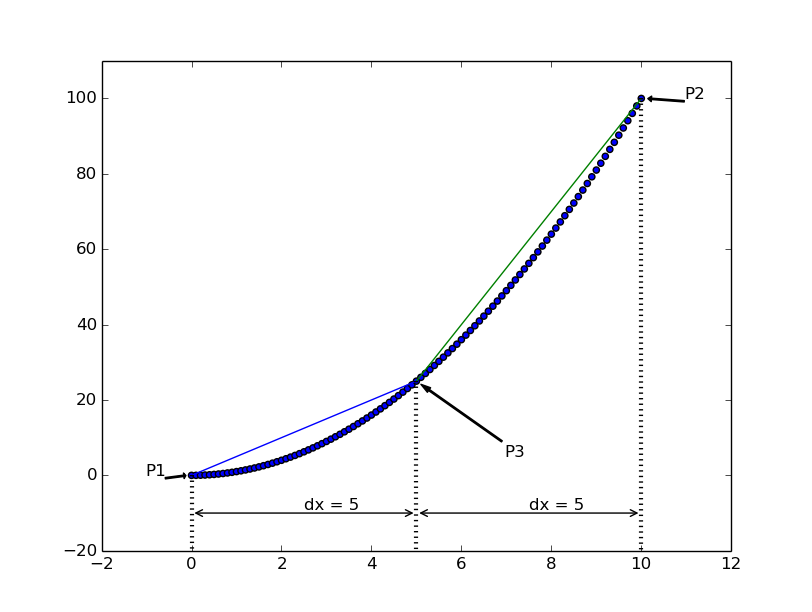
Figure 3: Putting a point in the middle makes it two lines and \(dx = 5\)
We make them three, we make them four and on and on. As we increase the number
of points (essentially increasing the number of lines) between x1 and x2, we
decrease the distance between two adjacent intermediate points. This is what the concept
of limit really is. In our case, we reduce the dx to almost 0. If we write down the
slope with this concept along with putting (\(y = f(x)\) and \(x2 = x + dx\)), we get the following:
\[\lim_{dx\to0} \frac{f(x+dx) - f(x)}{dx}\]
Differentiation is pretty much finding the slope of a curve at a point!
At one time in the past, the biggest scientists in europe made a fuss about how to write this and in the modern notation, it is commonly written as \(\frac{dy}{dx}\). Since, this may be a function as well - let us call this \(g(x)\).
All this sounds cool! But then what is integration exactly? We will take a U-turn from here. Let us take a plot again,
this time a simple straight line with one constant value
- which happens to be the slope that we measured of the line in figure 2. So, if we want the area under the line in figure 4, it is simply the area of the rectangle that will give us one
value.
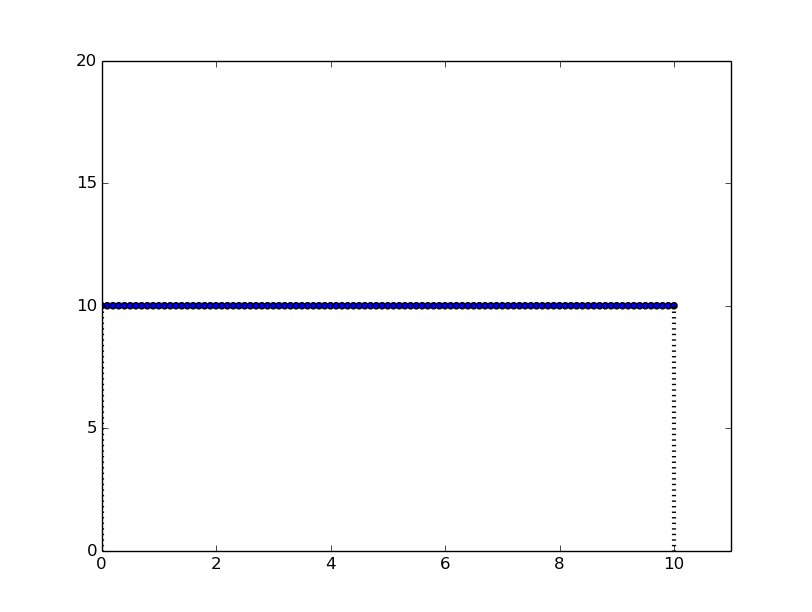
Figure 4: A single line that forms a rectangle with \(dx = 10\)
So, if we take the slopes of the 2 lines in figure 3 and plot them, they will look like the following image. The areas of these two rectangles will be two values.
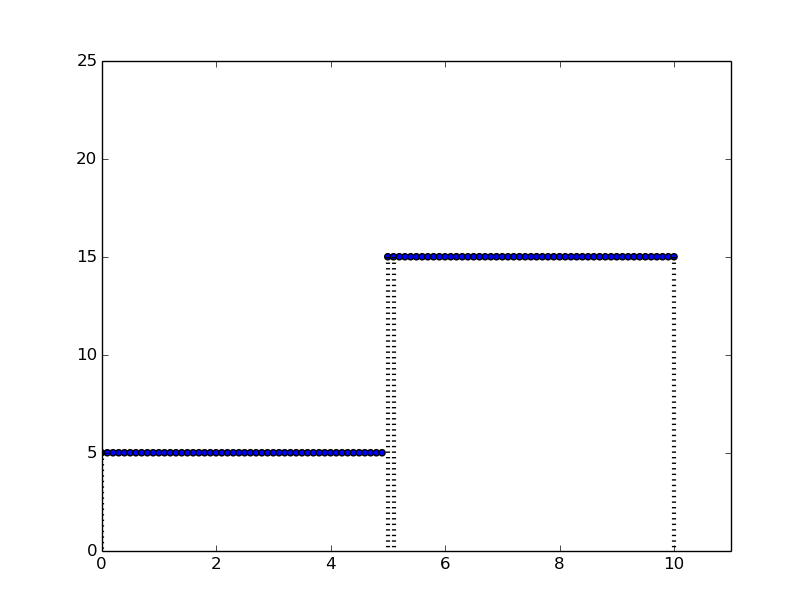
Figure 5: The two lines that form two rectangles with \(dx = 5\)
Let us do the same thing again, let us take the dx all the way to 0, then we get a teeny-tiny wide rectangle that looks like the following:
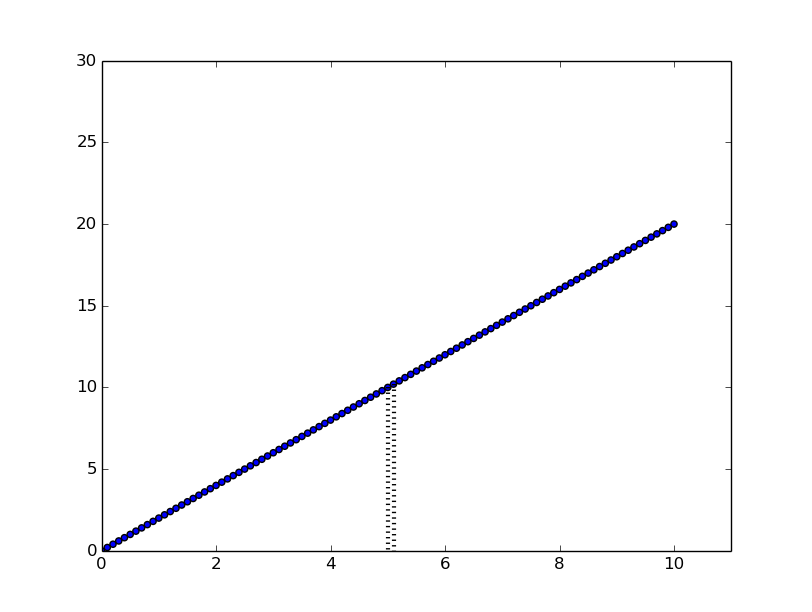
Figure 6: A small rectangle with \(dx\to0\)
The area of this teeny-tiny rectangle has a specific value at that point x. And if we put all such values from 0 to x together,
we get the indefinite integral that is often written with capital letter of the function - G(x) at x. So, if we write that down with the fancy integral symbol :
\[G(x) = \lim_{dx\to0} \sum_{0}^{x} g(x)dx = \int{g(x)dx}\]
That is it! If we plot all these values together, we will get a curve that kind of takes us back to figure 1 - saying :
\[f(x) = G(x) + c\]
*c is a random constant, which we will just ignore here!
A Dropping apple
Now, let us see how these concepts help us in a physical world. Let us take a random planet with g=2 and no atmosphere. If we drop an apple from some height and see the change in height as a function of time elapsed. It should follow an interesting motion that puzzled a couple of people before, who eventually became really really famous. Go ahead and press the button!
Of course, the first apple follows the laws of nature. But what is happening to the second and third apple? If we observe this closely, the second apple travels at a constant speed for the whole duration - like the line in figure 2 and figure 4.
The third apple - it travels with one speed first and then picks up a second speed - like the lines in figure 3 and figure 5.
So, the only figures left now are figure 6 & figure 1 - and that is what our actual apple follows! It has a speed that slowly increases
as time goes by. And this is what we call an acceleration. So in essence, we have three different properties here - position, speed and acceleration.
They are all connected the exact same way a function, a derivative and its derivative are connected.
Even though all the apples start at the same place and finish at the same place at the exact same time, their behaviour during the movement is defined by these properties!
Now given that the earth has g as acceleration, what will be the loss in height of an apple after t seconds? And yes!, the animation is a poor depiction of history :)